Abstract: The measurement limit of magnetoencephalography (MEG) can be achieved with approximately half the synchronized activity of the cerebral cortex required for scalp electroencephalography (EEG).
In the previous page, it was confirmed that MEG can measure or is required to measure current moments in units of 10 nAm [1]. So, how much area of the cerebral cortex needs to synchronize its activity to generate this current moment of 10 nAm?
The following discussion is based on physiological assumptions, experimental results, and clinical observations, but the results vary with each macroscopic verification. Physiological verification is a hypothetical discussion in the laboratory or test tube, so it doesn’t work as expected when applied to clinical practice.
Theoretical considerations:
The typical theoretical value of intracellular current generated by a dendrite due to a single synaptic post-synaptic potential is 0.02 pAm [1]. Although a single pyramidal cell has several dendrites and receives thousands of synapses, it is conservatively assumed that only 1/1000 of the post-synaptic potentials synchronize (0.02-0.2 pAm/cell). Considering that the density of pyramidal cells is 100,000 \( /mm^2 \) [1], theoretically, if \( 1 mm^2 \) of the cerebral cortex synchronizes its activity, it will result in 2-20 nAm, which can be measured by MEG.
Experimental considerations:
Experimentally, it is suggested that to generate 10 nAm, only a few tens of thousands of pyramidal cells need to synchronize, producing current moments of 0.2-3 pAm/cell [2].
However, experimental investigations using neural patches have shown that the required area to generate 10 nAm is much larger than the theoretical value, ranging from \( 25-100/mm^2 \) [3,4]. Nevertheless, \( 1/cm^2 \) is small enough on a macroscopic scale.
Clinical considerations:
So, when it comes to clinical applications, can we say that the detection sensitivity of MEG to brain activity is below \( 1/cm^2 \) of the cortex?
In clinical studies using intracranial electrodes, it has been confirmed dissapointingly that the cerebral cortex needs to synchronize at a rate of \( 3.0-4.0/cm^2 \) [5, 6].
Thus, the required cortical area increases as theoretical, experimental, and clinical discussions progress. However, scalp EEG demonstrates high sensitivity compared to the synchronization of \( 6-10/cm^2 \) of the cerebral cortex [7].
These phenomena are generally explained by the fact that in the actual brain, the orientations of pyramidal cells and their dendrites are diverse, resulting in the cancellation of currents, and the actual neuronal activity has temporal fluctuations and uneven synchronization [1, 8].
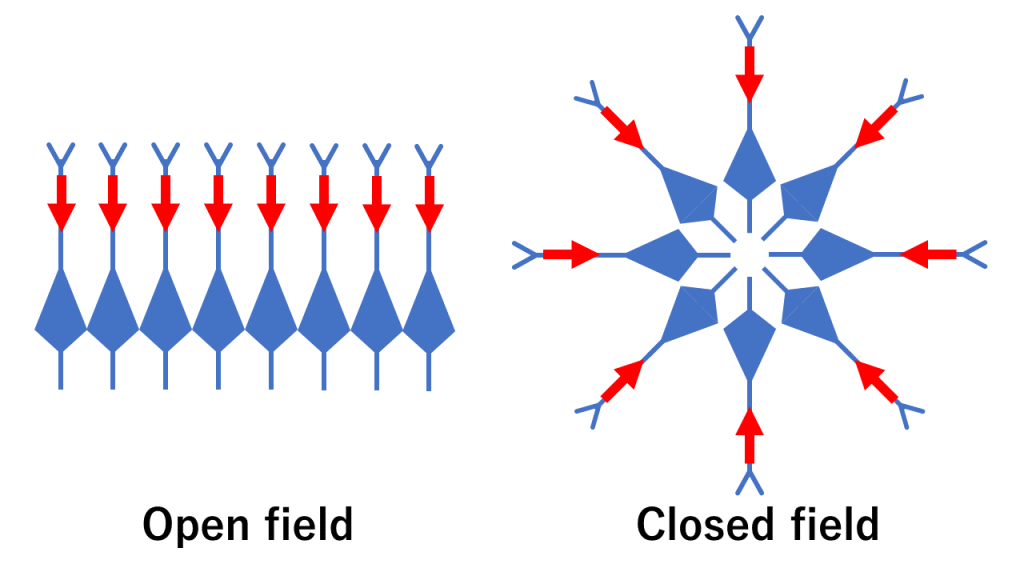
The webmaster believes that the traditional idea that neuronal cell alignments in the cortex form an open field (where intracellular currents sum up and magnetic fields are measurable), while deep neural nuclei form a closed field (where intracellular currents cancel out and magnetic fields are not measurable), is too simplistic and does not accurately represent the reality (see the figure below).

Although this interpretation is an extreme one based on classical literature [9], it has already become widely accepted, making it difficult to change. However, even in the case of the hippocampus, the cortex has complex shapes at the microscopic level [10], which can be observed in typical brain images. While it is natural for current and magnetic fields to cancel each other out, if we continue to rely on the same explanations for decades, appropriate models and experiments will be needed in the future.
The development of MEG started in 1968 when David Cohen measured the weak magnetic signals generated by the brain [11], and it took another 20 years for it to be sufficiently validated by physiological experiments [12]. In other words, MEG has historically been driven more by physics-based technology than by physiological validation. Since the physiological understanding only explains the phenomenon of MEG retroactively, a complete explanation is difficult to achieve.
Summary: The measurement limit of MEG is larger than the theoretical and expected values based on experiments, but it can capture high sensitivity by synchronizing approximately half the cerebral cortex activity required for scalp EEG.
Now that we understand the importance of measuring magnetic fields for MEG, let’s move on to discussing the sensors of the MEG system.
(References)
- Hämäläinen M, Hari R, Ilmoniemi R, Knuutila J, Lounasmaa O. Magnetoencephalography theory, instrumentation, and applications to noninvasive studies of the working human brain. Rev Mod Phys. 1993 Apr 1;65(2):413-97.
- Murakami S, Okada Y. Contributions of principal neocortical neurons to magnetoencephalography and electroencephalography signals. J Physiol. 2006 Sep 15;575(Pt 3):925-36.
- Baillet S, Mosher J, Leahy R. Electromagnetic brain mapping. IEEE Signal Process. Mag. 2001 Dec;18(6),14–30.
- Chapman RM, Ilmoniemi RJ, Barbanera S, Romani GL. Selective localization of alpha brain activity with neuromagnetic measurements. Electroencephalogr Clin Neurophysiol. 1984 Dec;58(6):569-72.
- Mikuni N, Nagamine T, Ikeda A, Terada K, Taki W, Kimura J, Kikuchi H, Shibasaki H. Simultaneous recording of epileptiform discharges by MEG and subdural electrodes in temporal lobe epilepsy. Neuroimage. 1997 May;5(4 Pt 1):298-306.
- Oishi M, Otsubo H, Kameyama S, Morota N, Masuda H, Kitayama M, Tanaka R. Epileptic spikes: magnetoencephalography versus simultaneous electrocorticography. Epilepsia. 2002 Nov;43(11):1390-5.
- Cooper R, Winter AL, Crow HJ, Walter WG. Comparison of subcortical, cortical and scalp activity using chronically indwelling electrodes in man. Electroencephalogr Clin Neurophysiol. 1965 Feb;18:217-28.
- Hansen Peter, Morten Kringelbach, and Riitta Salmelin (eds), MEG: An Introduction to Methods. New York, 2010; online edn, Oxford Academic, 1 Sept. 2010.
- LORENTE de NO R. Action potential of the motoneurons of the hypoglossus nucleus. Journal of Cellular and Comparative Physiology. 1947 Jun 1;29(3):207-287
- Larriva-Sahd JA. Some predictions of Rafael Lorente de Nó 80 years later. Front Neuroanat. 2014 Dec 3;8:147.
- Cohen D. Magnetoencephalography: evidence of magnetic fields produced by alpha-rhythm currents. Science. 1968 Aug 23;161(3843):784-6.
- Okada YC, Nicholson C. Magnetic evoked field associated with transcortical currents in turtle cerebellum. Biophys J. 1988 May;53(5):723-31.